Predicting NBA 3P% from College Part 1
The full data and code for this project can be found here. All data was scraped from Basketball Reference.
Can we predict NBA 3-point efficiency just using college stats?
Hitting on draft picks is hard in the NBA. For example, in 2012, Sacramento selected Thomas Robinson over Damian Lillard. Fast forward to today and Lillard is considered one of the best point guards and most efficient shooters in the NBA where Robinson has been out of the league for 3 years. If you look at any NBA draft you will find examples of this, some guys simply just don’t pan out for whatever reason. This article will try to find if we can predict one aspect of a NBA prospect’s professional future, 3 point efficiency, using just their college stats.
The Method
Using Python I scraped the college stats of NBA players who entered the league from 2009 to 2020, along with their professional 3 point stats, and placed them into a csv. The college stats taken were 3 point field goals per game, 3 point attempts per game, total 3 point field goals, total 3 point attempts, 3 pointer percentage, free throws made, free throw attempts, free throw percentage, true shooting percentage, effective field goal percentage, and 3 point attempt rate. For all of these I went with career stats. From here I filtered those who had not attempted 82 threes (the amount to qualify for the single season NBA 3 point percentage leaderboard since 2013), to try and limit situations such as those who only took 2 3s and made one, leaving them with 50% from 3. The players who entered the NBA from 2009-2018 I used as the training data to run linear and multiple linear regressions playing around with different college stats then used the 2019 and 2020 rookies to test the models. Below are the main functions I used to perform the regression.
import numpy as np

"""Determine R^2 value"""
def r_squared(x, y):
    corr_mat = np.corrcoef(x, y)
    r2 = (corr_mat[0,1])**2
    return r2

"""Find the weight vector for the regression"""
def regress(x, y):
    """ W = (X^T X)^-1 X^T Y) """
    x_t = x.transpose()
    w = np.linalg.inv(x_t.dot(x)).dot(x_t).dot(y)
    return w

"""Use the weight vector to predict the y values"""
def predict(x, w):
    return x.dot(w)

def multiple_regression(train_x, test_x, train_y, test_y):
    """Add ones for constant in weight vector"""
    dummy = np.ones((len(train_x),1))
    train_x = np.append(dummy,train_x,axis=1)
    dummy = np.ones((len(test_x),1))
    test_x = np.append(dummy,test_x,axis=1)
    """Find weight vector"""
    w = regress(train_x, train_y)
    """apply weight vector to training and testing data"""
    p_train = predict(train_x, w)
    p_test = predict(test_x, w)
    train_r2 = r_squared(train_y, p_train)
    test_r2 = r_squared(test_y, p_test)
    return w, p_train, p_test, train_r2, test_r2
Results
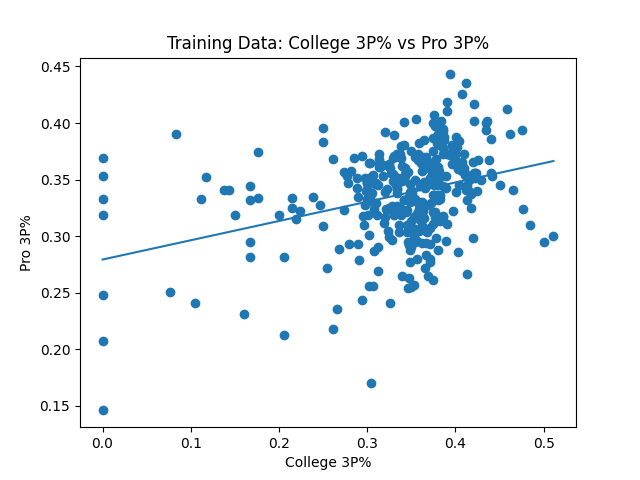
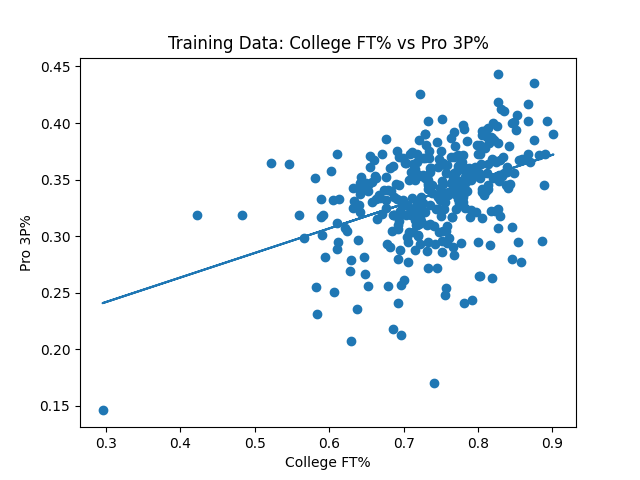
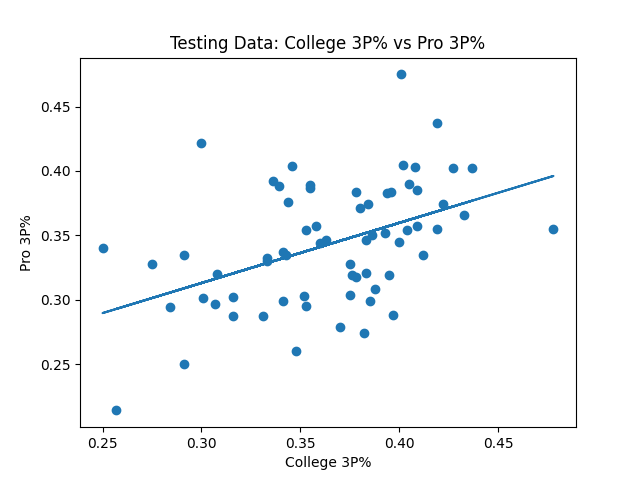
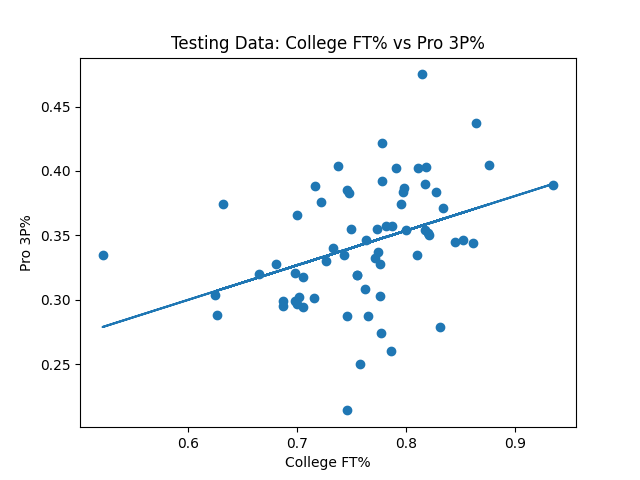
I started by testing the seemingly age old theory where college free throw success is a better indicator than college 3 point success for how efficient an NBA player would be with the 3 ball. The 2009-2018 data seemed to back this claim up. The R^2 value for college 3 point percentage vs NBA 3 point percentage came out to be 0.113, and for college free throw percentage it was a bit higher at 0.170. What was interesting though was for the test data, 2019-2020, the results were the opposite, 0.205 for college 3 point percentage and 0.149 for free throws.
When playing around with multiple regression, the best R2 value we got for predicted NBA 3 point percentage is based on the attributes 3 pointers made, 3 point attempts, 3 point percentage, free throws made, free throw attempts and free throw percentage. Using the per game stats and advanced stats, as well as leaving out any of the aforementioned attributes made the model worse when predicting for the test data. The R^2 value for this multiple regression model was 0.352, much better than the single stats alone.
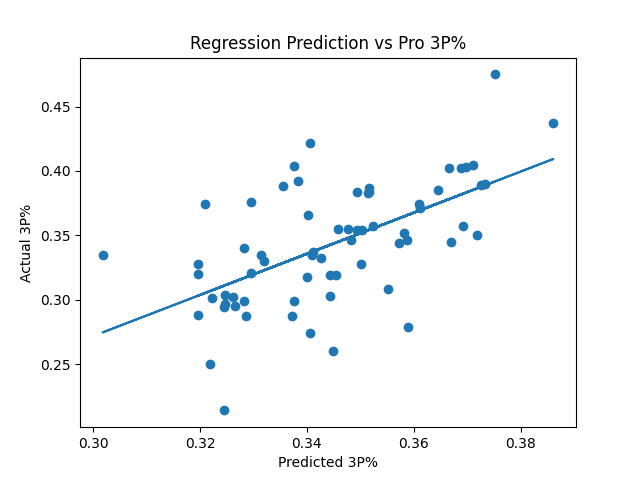
Here are the predictions our model created for some of the prominent young players in the league:
| Player | Predicted 3P% | Actual 3P% |
|---|---|---|
| Trae Young | 35.7% | 34.4% |
| Jaren Jackson | 34.9% | 38.4% |
| Duncan Robinson | 38.6% | 43.7% |
| Shai Gilgeous-Alexander | 35.0% | 35.4% |
| Rui Hachimura | 32.9% | 28.7% |
| Ja Mortant | 34.1% | 33.5% |
| RJ Barrett | 32.0% | 32.0% |
| Jordan Poole | 35.9% | 27.9% |
| Gary Trent | 37.1% | 40.5% |
| Michael Porter | 34.0% | 42.2% |
The predictions seemed a little sporadic with some guys overestimated, some under. It also seemed to no want to predict anything too extreme with all predictions falling between 30%-39%. The largest overestimation was Theo Pinson, who was predicted to shoot 32.4% from yet only shot 21.4% in his first 2 years for Brooklyn. the largest underestimation was Matt Thomas of the Raptors who was expected to shoot a solid 37.5%, yet shot 47.5% in his rookie year.
Conclusions
Is college free throw shooting a better indicator of NBA 3 point success than college 3 point success?
The data shows it used to be, but is no longer. I am thinking there are 2 possible reasons for this. The first being is that college players are taking more 3’s. In the data used for this analysis, the players who entered the league from 2009 to 2018 took an average of 3.18 3s a game, the 2019 and 2020 players took 3.99. This higher average might just give a larger sample size of deep shooting (even though it is slightly shorter in college) improving the correlation.
The other reason would be selection bias, in two ways. With choosing 82 attempted NBA 3s as the cutoff, it removes players who are bad 3 point shooters so they don’t take them at all. The guys who take over 82 are at least somewhat decent to be given the green light. This doubles down with my decision to use 2019 and 2020 as the test player data. If players reach 82 3s in 1-2 years, they must be pretty good, where some players may take 10 years to reach 82. So everyone used in the test data are expected to be solid 3 point shooters.
Can we predict NBA 3-point efficiency just using college stats?
Sort of, but not well. An R2 value of 0.352 shows some correlation, but it isn’t great. It was interesting that the per game metrics and the advanced stats didn’t help. This could be to the changing of the game with college players now playing after the 3 point boom so now more gameplans are trying to take advantage. With a changing game, using past data may actually be detrimental when trying to predict future data. The selection bias mentioned before may have had effects.
Overall, predicting humans is hard. It’s why we have so many draft busts like the one I mentioned. There’s a lot more that goes into it other than statistics, and to use just numbers will never be fully successful. Numbers need context and stories, and even then you can’t go inside a prospect’s head and find out every little thing that can affect his game.
Next Steps
The first thing I’d like to take a look at is ways to remove the selection bias created from, using some sort of adjusted 3 point percentage to make up for differences in attempts. I also plan on creating a model using something other than linear regression to see if that produces something more accurate.