Does Point Balance Correlate with Success in the NBA?
Point Balance (PB) is a metric introduced by Stephen Shea and Christopher Baker in their 2013 book, Basketball Analytics. It measures how balanced a team is in scoring, a high score means the team has a high distribution of scoring vs a low score which tells us only a few players do most of the scoring.
It is calculated by the distribution of points divided by the distribution of minutes which are defined by :
\[D(pts) = - \sum p_i * log_2(p_i)\] \[D(min) = - \sum m_i * log_2(m_i)\]where \(p_i \) and \(m_i \) are the total points and minutes for player i respectively, thus leading to
\[PB = \frac{D(pts)}{D(min)}\]The goal of this article is to determine if the Point Balance of a team has any correlation with its success, or even just its offensive success. For every team from 2011-2020, I calculated its PB score and took the winning percentage, offensive rating, effective FG%, whether or not that team made the playoffs, and whether or not that team won the finals.
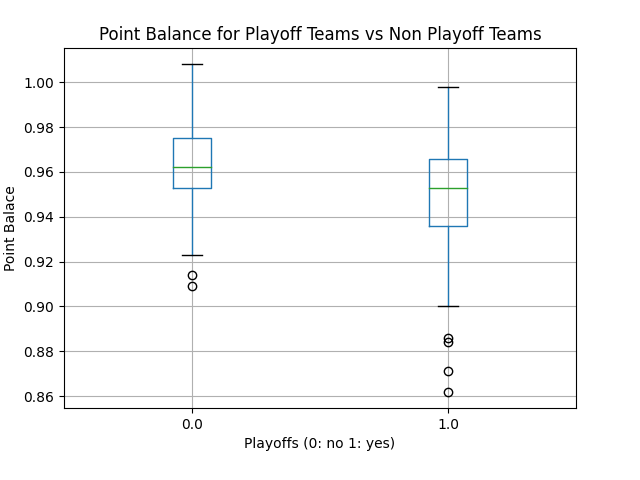
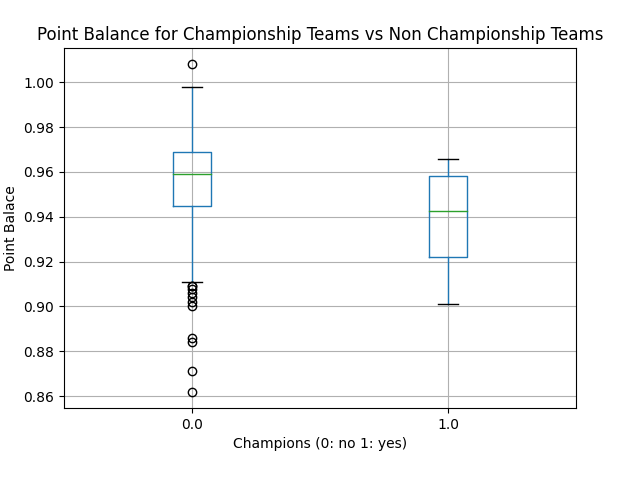
The overall average PB score for NBA teams over the last 10 years has been 0.955. The lowest PB score we saw was 0.862, by the 2011 ‘Big 3’ Miami Heat who ended up losing in the finals. The highest was 1.008 by the 2017 Philadelphia 76ers, who had a number of players suffer injuries throughout the season and went 28-54. The average score for playoff teams is 0.948 versus 0.963 for teams that missed the cut. Going further, those playoff teams that won the championship had an average of 0.939. So off the bat, it does seem to correlate at least a little bit. Below are the boxplots which help visualize the averages a little bit more, as well as the win percentage of teams plotted against their PB score.
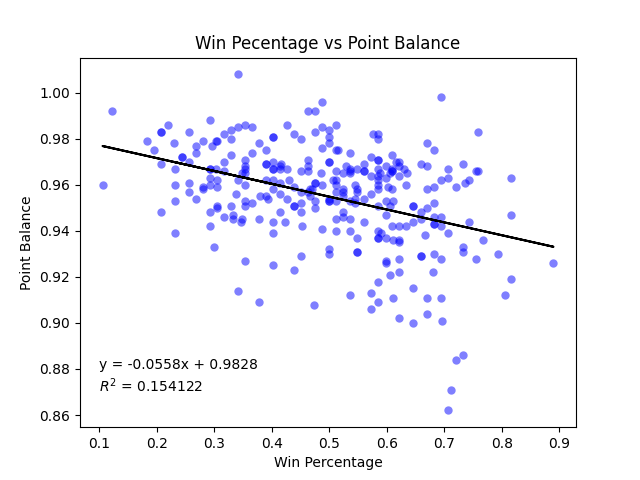
This trend even coincides a little bit with how efficient the team’s offense is. In the 2 categories I looked at, offensive rating and effective field goal percentage, there proved to be a negative correlation.
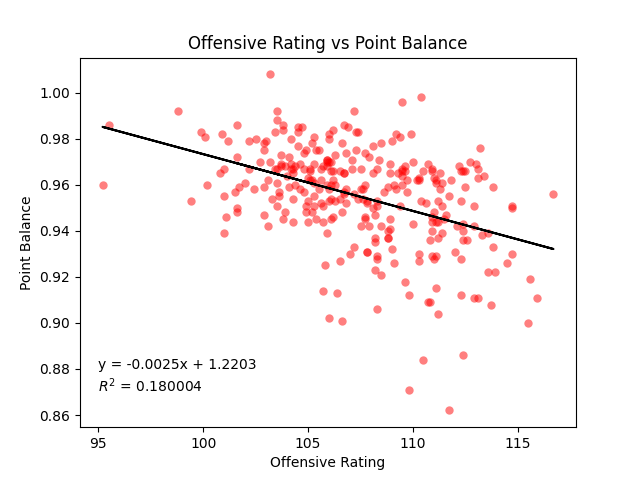
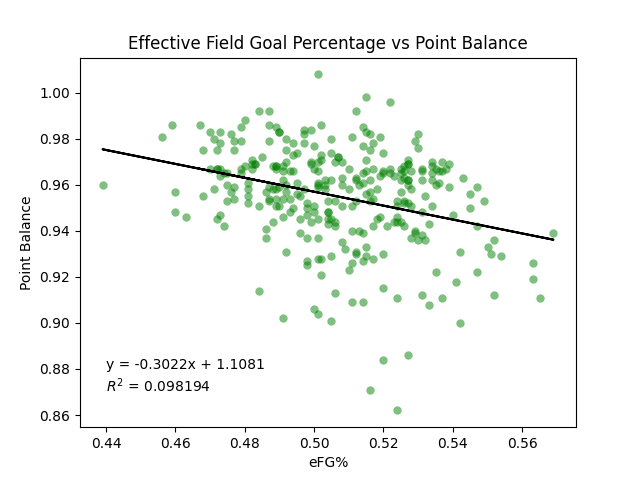
Now obviously these aren’t the strongest correlations, shown by their R^2 values, but there is definitely a general trend. Teams led by the few generally do better than teams led by the many.
Look at the highest and lowest PB scores by year. Only 1 team made the playoffs having the highest PB score, the 2013 Denver Nuggets who had 5 guys scoring double digits and Ty Lawson leading the team at 16.7 ppg. They lost in the first round in 6 games. The minimum PB scores had an overall win percentage of 0.431. On the other end, not a single team missed the playoffs when they had the highest PB score, granted 6 of those years were the Thunder and 2 had Lebron. These scores had an overall win percentage of 0.641, yet interestingly, not a single one was able to seize the Larry O’Brien Trophy.
Highest
| year | team | wins | losses | wpct | ortg | eFG% | pb | playoffs | champions |
|---|---|---|---|---|---|---|---|---|---|
| 2011 | PHO | 40 | 42 | 0.488 | 109.500 | 0.522 | 0.996 | 0.000 | 0.000 |
| 2012 | PHO | 33 | 33 | 0.500 | 106.200 | 0.499 | 0.984 | 0.000 | 0.000 |
| 2013 | DEN | 57 | 25 | 0.695 | 110.400 | 0.515 | 0.998 | 1.000 | 0.000 |
| 2014 | DEN | 36 | 46 | 0.439 | 106.000 | 0.497 | 0.982 | 0.000 | 0.000 |
| 2015 | IND | 38 | 44 | 0.463 | 103.500 | 0.484 | 0.992 | 0.000 | 0.000 |
| 2016 | PHI | 10 | 72 | 0.122 | 98.800 | 0.487 | 0.992 | 0.000 | 0.000 |
| 2017 | PHI | 28 | 54 | 0.341 | 103.200 | 0.501 | 1.008 | 0.000 | 0.000 |
| 2018 | DET | 39 | 43 | 0.476 | 107.200 | 0.512 | 0.992 | 0.000 | 0.000 |
| 2019 | MIA | 39 | 43 | 0.476 | 107.300 | 0.515 | 0.983 | 0.000 | 0.000 |
| 2020 | DET | 20 | 46 | 0.303 | 109.000 | 0.529 | 0.979 | 0.000 | 0.000 |
Lowest
| year | team | wins | losses | wpct | ortg | eFG% | pb | playoffs | champions |
|---|---|---|---|---|---|---|---|---|---|
| 2011 | MIA | 58 | 24 | 0.707 | 111.700 | 0.524 | 0.862 | 1.000 | 0.000 |
| 2012 | OKC | 47 | 19 | 0.712 | 109.800 | 0.516 | 0.871 | 1.000 | 0.000 |
| 2013 | OKC | 60 | 22 | 0.732 | 112.400 | 0.527 | 0.886 | 1.000 | 0.000 |
| 2014 | OKC | 59 | 23 | 0.720 | 110.500 | 0.520 | 0.884 | 1.000 | 0.000 |
| 2015 | CLE | 53 | 29 | 0.646 | 111.100 | 0.520 | 0.915 | 1.000 | 0.000 |
| 2016 | OKC | 55 | 27 | 0.671 | 113.100 | 0.524 | 0.911 | 1.000 | 0.000 |
| 2017 | OKC | 47 | 35 | 0.573 | 108.300 | 0.500 | 0.906 | 1.000 | 0.000 |
| 2018 | OKC | 48 | 34 | 0.585 | 110.700 | 0.514 | 0.909 | 1.000 | 0.000 |
| 2019 | HOU | 53 | 29 | 0.646 | 115.500 | 0.542 | 0.900 | 1.000 | 0.000 |
| 2020 | POR | 35 | 39 | 0.473 | 113.700 | 0.533 | 0.908 | 1.000 | 0.000 |
So what does this mean? Would the 10-72 76ers have been better if they gave rookie Jahlil Okafor 10 more touches a game to increase his scoring? Of course not. But it shows that something that we all probably knew, stars run the NBA. Teams need guys that can and will take over a game to get wins. With this though, it’s not really a surprise that the lowest score never won the championship. Stars only get you so far. For example, the 2011 Heat who just got the Big 3 had the lowest score in the last 10 years. In the finals, when LeBron doesn’t play like his usual self it is hard to overcome that hole if there aren’t other players who can step up. Fast forward a year, a few guys like Mario Chalmers improved and the team brought in some new players like Shane Battier. Funnily enough, when they reached the finals, it was against a team in a similar position as the previous Heat team. 3 budding stars and not much other help. Looking at other championship teams, it’s no surprise what the high PB teams were. The 2014 Spurs, 2019 Raptors, and 2011 Mavericks are the top 3 respectively and were all considered great and deep ‘teams’ vs the star lead Heat and Warriors. So the formula to raise a trophy in the NBA is simple, get some stars, but also get some solid role players around those stars. That can’t be too hard right?
Champions
| year | team | wins | losses | wpct | ortg | eFG% | pb | playoffs | champions |
|---|---|---|---|---|---|---|---|---|---|
| 2011 | DAL | 57 | 25 | 0.695 | 109.700 | 0.525 | 0.962 | 1.000 | 1.000 |
| 2012 | MIA | 46 | 20 | 0.697 | 106.600 | 0.505 | 0.901 | 1.000 | 1.000 |
| 2013 | MIA | 66 | 16 | 0.805 | 112.300 | 0.552 | 0.912 | 1.000 | 1.000 |
| 2014 | SAS | 62 | 20 | 0.756 | 110.500 | 0.537 | 0.966 | 1.000 | 1.000 |
| 2015 | GSW | 67 | 15 | 0.817 | 111.600 | 0.540 | 0.947 | 1.000 | 1.000 |
| 2016 | CLE | 57 | 25 | 0.695 | 110.900 | 0.524 | 0.946 | 1.000 | 1.000 |
| 2017 | GSW | 67 | 15 | 0.817 | 115.600 | 0.563 | 0.919 | 1.000 | 1.000 |
| 2018 | GSW | 58 | 24 | 0.707 | 113.600 | 0.569 | 0.939 | 1.000 | 1.000 |
| 2019 | TOR | 58 | 24 | 0.707 | 113.100 | 0.543 | 0.963 | 1.000 | 1.000 |
| 2020 | LAL | 52 | 19 | 0.732 | 112.000 | 0.542 | 0.931 | 1.000 | 1.000 |
Just for fun, here are the highest and lowest PB scores for each team over the last 10 years.
Highest
| year | team | wins | losses | wpct | ortg | eFG% | pb | playoffs | champions |
|---|---|---|---|---|---|---|---|---|---|
| 2014 | ATL | 38 | 44 | 0.463 | 105.900 | 0.515 | 0.971 | 1.000 | 0.000 |
| 2015 | BOS | 40 | 42 | 0.488 | 104.700 | 0.489 | 0.985 | 1.000 | 0.000 |
| 2018 | BRK | 28 | 54 | 0.341 | 106.900 | 0.514 | 0.985 | 0.000 | 0.000 |
| 2018 | CHI | 27 | 55 | 0.329 | 103.800 | 0.497 | 0.984 | 0.000 | 0.000 |
| 2015 | CHO | 33 | 49 | 0.402 | 100.100 | 0.456 | 0.981 | 0.000 | 0.000 |
| 2011 | CLE | 19 | 63 | 0.232 | 102.200 | 0.472 | 0.967 | 0.000 | 0.000 |
| 2016 | DAL | 42 | 40 | 0.512 | 106.700 | 0.502 | 0.986 | 1.000 | 0.000 |
| 2013 | DEN | 57 | 25 | 0.695 | 110.400 | 0.515 | 0.998 | 1.000 | 0.000 |
| 2018 | DET | 39 | 43 | 0.476 | 107.200 | 0.512 | 0.992 | 0.000 | 0.000 |
| 2020 | GSW | 15 | 50 | 0.231 | 105.200 | 0.497 | 0.978 | 0.000 | 0.000 |
| 2012 | HOU | 34 | 32 | 0.515 | 105.500 | 0.492 | 0.975 | 0.000 | 0.000 |
| 2015 | IND | 38 | 44 | 0.463 | 103.500 | 0.484 | 0.992 | 0.000 | 0.000 |
| 2017 | LAC | 51 | 31 | 0.622 | 112.700 | 0.537 | 0.970 | 1.000 | 0.000 |
| 2015 | LAL | 21 | 61 | 0.256 | 103.400 | 0.473 | 0.983 | 0.000 | 0.000 |
| 2018 | MEM | 22 | 60 | 0.268 | 104.500 | 0.500 | 0.977 | 0.000 | 0.000 |
| 2019 | MIA | 39 | 43 | 0.476 | 107.300 | 0.515 | 0.983 | 0.000 | 0.000 |
| 2011 | MIL | 35 | 47 | 0.427 | 101.600 | 0.467 | 0.986 | 0.000 | 0.000 |
| 2013 | MIN | 31 | 51 | 0.378 | 102.900 | 0.473 | 0.978 | 0.000 | 0.000 |
| 2012 | NOP | 21 | 45 | 0.318 | 100.900 | 0.476 | 0.982 | 0.000 | 0.000 |
| 2015 | NYK | 17 | 65 | 0.207 | 99.900 | 0.470 | 0.983 | 0.000 | 0.000 |
| 2020 | OKC | 44 | 28 | 0.611 | 110.800 | 0.530 | 0.936 | 1.000 | 0.000 |
| 2013 | ORL | 20 | 62 | 0.244 | 101.600 | 0.485 | 0.972 | 0.000 | 0.000 |
| 2017 | PHI | 28 | 54 | 0.341 | 103.200 | 0.501 | 1.008 | 0.000 | 0.000 |
| 2011 | PHO | 40 | 42 | 0.488 | 109.500 | 0.522 | 0.996 | 0.000 | 0.000 |
| 2019 | POR | 53 | 29 | 0.646 | 114.700 | 0.528 | 0.951 | 1.000 | 0.000 |
| 2011 | SAC | 24 | 58 | 0.293 | 103.500 | 0.480 | 0.988 | 0.000 | 0.000 |
| 2015 | SAS | 55 | 27 | 0.671 | 108.500 | 0.517 | 0.978 | 1.000 | 0.000 |
| 2013 | TOR | 34 | 48 | 0.415 | 105.900 | 0.488 | 0.968 | 0.000 | 0.000 |
| 2018 | UTA | 48 | 34 | 0.585 | 108.400 | 0.527 | 0.971 | 1.000 | 0.000 |
| 2016 | WAS | 41 | 41 | 0.500 | 105.300 | 0.511 | 0.981 | 0.000 | 0.000 |
Lowest
| year | team | wins | losses | wpct | ortg | eFG% | pb | playoffs | champions |
|---|---|---|---|---|---|---|---|---|---|
| 2020 | ATL | 20 | 47 | 0.299 | 107.200 | 0.515 | 0.933 | 0.000 | 0.000 |
| 2020 | BOS | 48 | 24 | 0.667 | 113.300 | 0.531 | 0.938 | 1.000 | 0.000 |
| 2011 | BRK | 49 | 33 | 0.598 | 108.200 | 0.498 | 0.942 | 1.000 | 0.000 |
| 2011 | CHI | 62 | 20 | 0.756 | 108.300 | 0.501 | 0.928 | 1.000 | 0.000 |
| 2018 | CHO | 36 | 46 | 0.439 | 109.400 | 0.508 | 0.951 | 0.000 | 0.000 |
| 2015 | CLE | 53 | 29 | 0.646 | 111.100 | 0.520 | 0.915 | 1.000 | 0.000 |
| 2014 | DAL | 49 | 33 | 0.598 | 111.200 | 0.526 | 0.953 | 1.000 | 0.000 |
| 2011 | DEN | 50 | 32 | 0.610 | 112.300 | 0.526 | 0.966 | 1.000 | 0.000 |
| 2019 | DET | 41 | 41 | 0.500 | 109.000 | 0.509 | 0.932 | 1.000 | 0.000 |
| 2019 | GSW | 57 | 25 | 0.695 | 115.900 | 0.565 | 0.911 | 1.000 | 0.000 |
| 2019 | HOU | 53 | 29 | 0.646 | 115.500 | 0.542 | 0.900 | 1.000 | 0.000 |
| 2011 | IND | 37 | 45 | 0.451 | 104.800 | 0.486 | 0.957 | 1.000 | 0.000 |
| 2012 | LAC | 40 | 26 | 0.606 | 108.500 | 0.502 | 0.921 | 1.000 | 0.000 |
| 2012 | LAL | 41 | 25 | 0.621 | 106.000 | 0.491 | 0.902 | 1.000 | 0.000 |
| 2017 | MEM | 43 | 39 | 0.524 | 107.700 | 0.491 | 0.946 | 1.000 | 0.000 |
| 2011 | MIA | 58 | 24 | 0.707 | 111.700 | 0.524 | 0.862 | 1.000 | 0.000 |
| 2018 | MIL | 44 | 38 | 0.537 | 109.800 | 0.531 | 0.912 | 1.000 | 0.000 |
| 2017 | MIN | 31 | 51 | 0.378 | 110.800 | 0.511 | 0.909 | 0.000 | 0.000 |
| 2018 | NOP | 48 | 34 | 0.585 | 109.600 | 0.541 | 0.918 | 1.000 | 0.000 |
| 2013 | NYK | 54 | 28 | 0.659 | 111.100 | 0.515 | 0.929 | 1.000 | 0.000 |
| 2012 | OKC | 47 | 19 | 0.712 | 109.800 | 0.516 | 0.871 | 1.000 | 0.000 |
| 2011 | ORL | 52 | 30 | 0.634 | 107.900 | 0.521 | 0.942 | 1.000 | 0.000 |
| 2019 | PHI | 51 | 31 | 0.622 | 112.600 | 0.532 | 0.936 | 1.000 | 0.000 |
| 2019 | PHO | 19 | 63 | 0.232 | 105.900 | 0.514 | 0.939 | 0.000 | 0.000 |
| 2020 | POR | 35 | 39 | 0.473 | 113.700 | 0.533 | 0.908 | 1.000 | 0.000 |
| 2014 | SAC | 28 | 54 | 0.341 | 105.700 | 0.484 | 0.914 | 0.000 | 0.000 |
| 2017 | SAS | 61 | 21 | 0.744 | 111.100 | 0.524 | 0.944 | 1.000 | 0.000 |
| 2017 | TOR | 51 | 31 | 0.622 | 112.300 | 0.517 | 0.928 | 1.000 | 0.000 |
| 2011 | UTA | 39 | 43 | 0.476 | 108.100 | 0.498 | 0.950 | 0.000 | 0.000 |
| 2017 | WAS | 49 | 33 | 0.598 | 111.200 | 0.528 | 0.937 | 1.000 | 0.000 |
The full code for scraping the data, analyzing it, plus the output images and tables can be found on my Github account here. All stats were scraped from basketball-reference.com.